FERC Highlights:
In its latest monthly "Energy Infrastructure Update" report (with data through September 30, 2023), FERC says solar provided 9,924 megawatts (MW) of new domestic generating capacity or 42.4% of the total. Moreover, solar capacity additions during the first nine months of this year were almost a third (32.8%) larger than for the same period last year.
The new solar capacity additions edged past the 8,962-MW of new natural gas (38.2%) and were nine times greater than that provided by the new 1,100-MW Vogtle-3 nuclear reactor (4.7%) in Georgia as well as by oil (54-MW) and waste heat (31-MW).
Other renewable energy sources have also experienced growth this year. Wind provided an additional 3,062-MW (13.1%). With the inclusion of hydropower (224-MW), geothermal (44-MW), and biomass (30-MW), the mix of renewable energy sources has accounted for the majority (56.7%) of new capacity added since January.
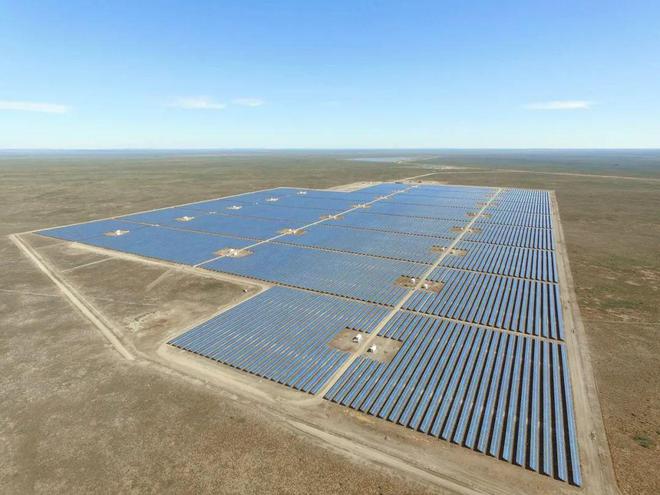
In September alone, 24 new “units” of solar, totaling 881-MW, came on-line, including the 250-MW Oberon Renewable Energy Project in Riverside County, California and the 206-MW Shakes Solar Project in Dimmit County, Texas. These and other solar additions brought utility-scale (i.e., >1-MW) solar’s share of total available installed generating capacity in the U.S. up to 7.3%, from 6.1% a year earlier. [1]
While solar’s share of total installed U.S. generating capacity still trails wind (11.6%) it is rapidly closing in on that of hydropower (7.9%). Taken together, the installed capacity of all renewable sources, including biomass (1.2%) and geothermal (0.3%), was 28.3% of the nation’s total at the end of the first nine months of 2023 – up from 27.0% a year earlier.
Solar’s strong growth seems likely to continue. FERC reports that “high probability” additions of solar between October 2023 and September 2026 total 85,657-MW – an amount over four times more than the forecast net “high probability” additions for wind (20,333-MW) and 20+ times greater than those projected for natural gas (4,150-MW).
And the numbers for solar may prove to be conservative. FERC also reports that there may actually be as much as 215,985-MW of new solar additions in the three-year pipeline. Moreover, FERC’s three-year forecast for solar increases with each new monthly “Infrastructure” report.
If just the “high probability” additions materialize, by late summer 2026, solar will account for more than one-eighth (13.1%) of the nation’s installed generating capacity. That would be more than either wind (12.3%) or hydropower (7.5%). Solar’s installed generating capacity by September 2026 would also surpass of oil (2.6%) and nuclear power (7.5%) combined as well as approach that of coal (13.9%). [2]
In three years, natural gas would still comprise the largest share of installed generating capacity (41.6%) but the mix of all renewable sources (i.e., solar plus wind, hydropower, geothermal, and biomass) would total 34.4% and continue to further narrow natural gas’ lead.
EIA Highlights:
The latest issue of EIA's "Electric Power Monthly" report (with data through September 30, 2023) reveals that in the first nine months of this year, electrical generation by the mix of renewables (i.e., biomass, geothermal, hydropower, solar, wind) accounted for 22.7% of U.S. electrical generation. That share is up slightly from the 22.5% reported for the first three-quarters of 2022.
Solar (including small-scale distributed systems) grew by 14.3%, compared to the same period in 2022 - more than any other energy source. This was driven in large part by growth in "estimated" small-scale (e.g., rooftop) solar PV whose output increased by 19.8% and accounted for nearly a third (30.8%) of total solar production. For the nine-month period, solar was 5.8% of total U.S. electrical generation. A year earlier, solar's share was 5.0%.
Moreover, solar's year-to-date electrical generation exceeded that of hydropower by 2.3%. In addition, the estimated electrical generation by just small-scale distributed solar systems exceeded that produced by geothermal, wood and other biomass combined.
From January to September, solar combined with wind accounted for 15.5% of the nation's electrical generation - up from 14.8% for the same period a year earlier. For the nine-month period, solar plus wind nearly equaled coal's share (16.0%) as electrical generation by the latter plummeted by 20.2%.
Further, electrical generation by the mix of all renewables exceeded by more than a quarter (26.0%) that provided by nuclear power, whose output rose by only 0.2% notwithstanding the commissioning of theVogtle-3 reactor.
However, EIA's data also revealed some potentially worrisome trends for continued growth in electrical generation by renewable sources. Compared to the first nine months of 2022, geothermal power grew by 2.6% but electrical generation by wind fell by 2.7%. Hydropower was down by 8.7% while wood + other biomass dropped by 8.1%.
"In the aftermath of the 1973 Arab oil embargo fifty years ago, virtually no thought was given to solar as a future energy resource," noted the SUN DAY Campaign's executive director Ken Bossong. "But now, along with wind and other renewable energy sources, it is leading the nation’s transition away from nuclear power and fossil fuels to a cleaner and safer energy future."
# # # # # # # # #
Sources:
FERC's 6-page "Energy Infrastructure Update for September 2023" was released on November 20, 2023, and can be found at: https://cms.ferc.gov/media/energy-infrastructure-update-september-2023. For the information cited in this update, see the tables entitled "New Generation In-Service (New Build and Expansion)," "Total Available Installed Generating Capacity," and "Generation Capacity Additions and Retirements."
FERC's 6-page "Energy Infrastructure Update for September 2022" can be found at: https://cms.ferc.gov/media/energy-infrastructure-update-september-2022
EIA's latest "Electric Power Monthly" report was released on November 22, 2023. For the data cited in this news release, see Table ES1.A "Total Electric Power Industry Summary Statistics 2023 and 2022" and Table ES1.B “Total Electric Power Industry Summary Statistics, Year-to-Date 2023 and 2022”at:
https://www.eia.gov/electricity/monthly/epm_table_grapher.php?t=table_es1a
https://www.eia.gov/electricity/monthly/epm_table_grapher.php?t=table_es1b
Notes:
[1] FERC generally only reports data for utility-scale facilities (i.e., those rated 1-MW or greater) and therefore its data do not reflect the capacity of distributed renewables, notably rooftop solar PV which - according to the U.S. Energy Information Administration (EIA) - accounted for approximately 31% of the nation's electrical generation by solar during the first nine months of 2023. That would imply that the total of distributed and utility-scale solar capacity combined is significantly more than the solar capacity of 7.27% reported by FERC at the end of the first nine months of 2023 and is perhaps closer to 10.0%.
[2] Generating capacity is not the same as actual generation. Fossil fuels and nuclear power generally have higher "capacity factors" than do wind and solar. For example, EIA reports capacity factors in 2022 for nuclear power and natural gas were 92.6% and 56.7% respectively while those for wind and solar were 36.1% and 24.8%.