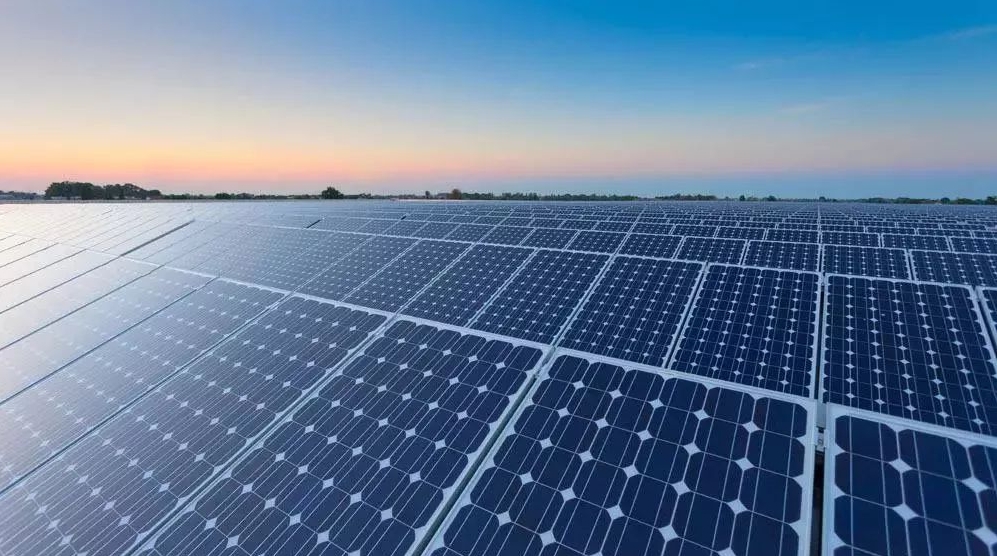
In its latest monthly "Energy Infrastructure Update" report (with data through December 31, 2023), FERC says last year solar provided 18,356-MW of new domestic generating capacity or 49.3% of the total. That is more than any other energy source and more than the combined new capacity from natural gas (11,024-MW) and wind (6,356-MW). Moreover, solar capacity additions in 2023 were 50.0% greater than the year before.
Capacity additions by solar in December alone set a new monthly record - 4,979-MW - and accounted for 57.1% of new capacity placed into service. That is more than double the previous monthly record of 1,982-MW set just the prior month.
The balance of new capacity in December came from wind (1,931-MW), natural gas (1,810-MW), and hydropower (2-MW). The mix of renewables thus provided 79.2% of capacity additions for the month.
For the twelve months of 2023, renewables provided more than two-thirds (67.2%) of all new generating capacity, trailed by natural gas (29.6%) and nuclear power (3.0%). There were small contributions from oil (64-MW), geothermal (48-MW), biomass (35-MW), and waste heat (31-MW). No new coal capacity was reported.
The latest capacity additions have brought solar’s share of total available installed generating capacity up to 7.9%, thereby tying that of hydropower. Wind is currently at 11.7%. With the inclusion of biomass (1.2%) and geothermal (0.3%), renewables now claim a 29.0% share of total U.S. utility-scale generating capacity.
For perspective, at the beginning of 2023, solar’s share was 6.4% while wind and hydropower were 11.4% and 8.0% respectively. The mix of all renewables totaled 27.3%. [1]
If the growth trends of 2023 continue, installed utility-scale solar capacity should exceed that of nuclear power (8.0%) within the next few months. [2]
Solar capacity is also likely to exceed the individual capacities of both wind and coal within the next three years.
FERC reports that “high probability” additions of solar between January 2024 and December 2026 total 87,098-MW – an amount more than triple the forecast net “high probability” additions for wind (24,495-MW), the second fastest growing resource. FERC also foresees 565-MW of hydropower growth as well as 1,100-MW from the Vogtle-4 reactor in Georgia while coal, natural gas, and oil are projected to contract by 21,911-MW, 3,266-MW, and 2,049-MW respectively.
The numbers for solar may prove to be conservative. FERC reports that there may actually be as much as 218,929-MW of net new solar additions in the three-year pipeline in addition to 75,552-MW of new wind and 7,727-MW of new hydropower. By contrast, net new natural gas additions total only 10,855-MW.
If just the current “high probability” additions materialize, by the end of 2026, solar will account for almost one-seventh (13.7%) of the nation’s installed utility-scale generating capacity. That would be more than either coal (13.6%) or wind (12.8%) and substantially more than either nuclear power (7.6%) or hydropower (7.4%). Solar plus wind will constitute more than three-quarters of utility-scale renewable energy capacity.
However, it should be noted that FERC only reports data for utility-scale facilities (i.e., those rated 1-MW or greater) and therefore its data do not reflect the capacity of distributed renewables, notably rooftop solar PV. According to the U.S. Energy Information Administration (EIA), small-scale solar PV is estimated to have accounted for 30.9% of the nation's electrical generation by solar during the first eleven months of 2023. [3]
That suggests that the total of distributed and utility-scale solar capacity combined is significantly more than the 7.9% FERC reported as solar’s share of total capacity at the end of 2023. It is perhaps closer to 11.0% and on track to approach or exceed 18.0% within three years.
It would also bring the generating capacity provided by the mix of all renewables close to – or even surpass - that of natural gas.
In three years, natural gas would still comprise the largest share of installed utility-scale generating capacity (40.9%), down from 43.9% at the end of 2023. However, solar would be in second place while the mix of all renewable sources (i.e., solar plus wind, hydropower, geothermal, and biomass) would total 35.3% of utility-scale capacity, up from 29.0% today.
However, if small-scale solar is factored in, by the end of 2026, renewables could constitute 38.9% of U.S. generating capacity while natural gas’ share would drop to 38.6%. Renewables’ share could be even greater if a larger portion of the solar and wind in the three-year pipeline (i.e., above and beyond the “high probability” additions) comes on-line.
"Solar ended 2023 by setting a record-high number of installations in December and providing half of the nation’s new generating capacity for the year while pulling even with hydropower," noted the SUN DAY Campaign's executive director Ken Bossong. "Moreover, the mix of all renewable energy sources appears to be on track to soon surpass the generating capacity of natural gas while solar alone will have more generating capacity than coal, wind, or nuclear power."
