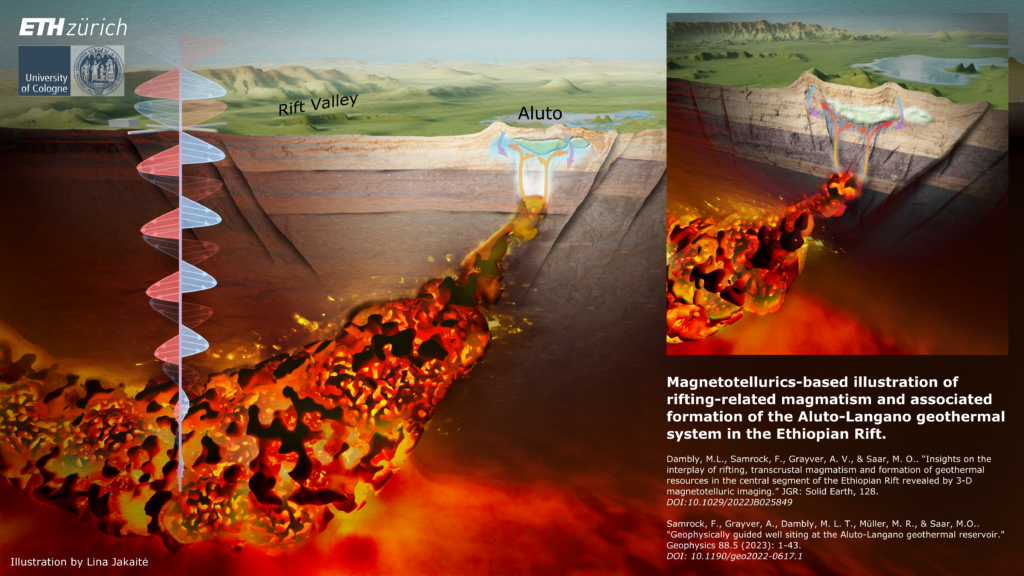
 3D illustration based on the MT model of the Aluto-Langano geothermal system, Ethiopia (source: Lina Jakait? via LinkedIn)
The 3D images from MT modeling were then used as basis for a 3D illustration done by Lina Jakaite.
The reference studies are as follows:
Geophysically guided well siting at the Aluto-Langano geothermal reservoir (https://doi.org/10.1190/geo2022-0617.1)
Insights on the Interplay of Rifting, Transcrustal Magmatism and Formation of Geothermal Resources in the Central Segment of the Ethiopian Rift Revealed by 3-D Magnetotelluric Imaging (https://doi.org/10.1029/2022JB025849)
We would like to thank the authors of the studies Friedemann Samrock, Alexander Grayver, Marie Luise Texas Dambly, Madeleine R. Müller, and Martin O. Saar, for allowing us to use the studies as material for this article.
The Aluto-Langano geothermal field
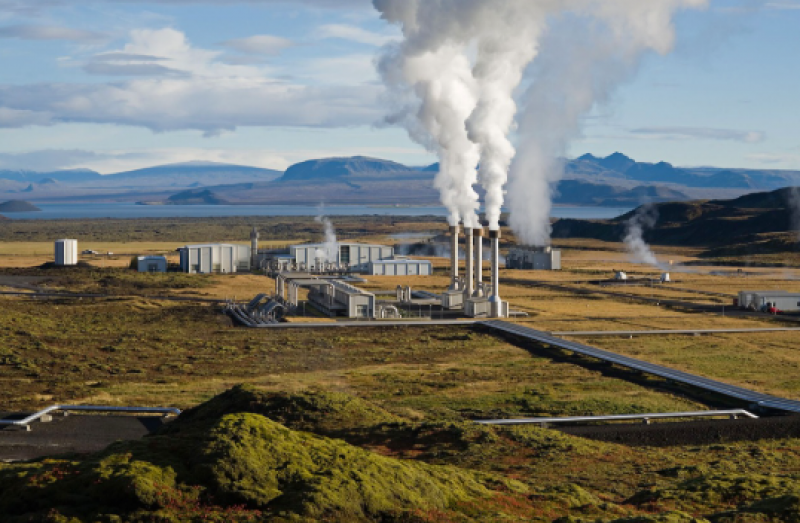
The geothermal resources in Ethiopia are centered around the active magmatism along the Main Ethiopian Rift (MER), which is the northern part of the larger East African Rift. Rifting-related magmatic processes in the MER lead to magma transport from the lower crust to the surface. The shallow intrusions brought about by this process provide the ideal geologic setting for the formation of magma-driven geothermal systems.
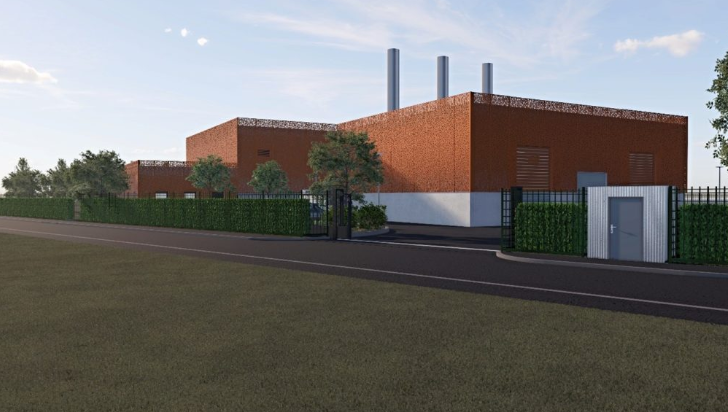
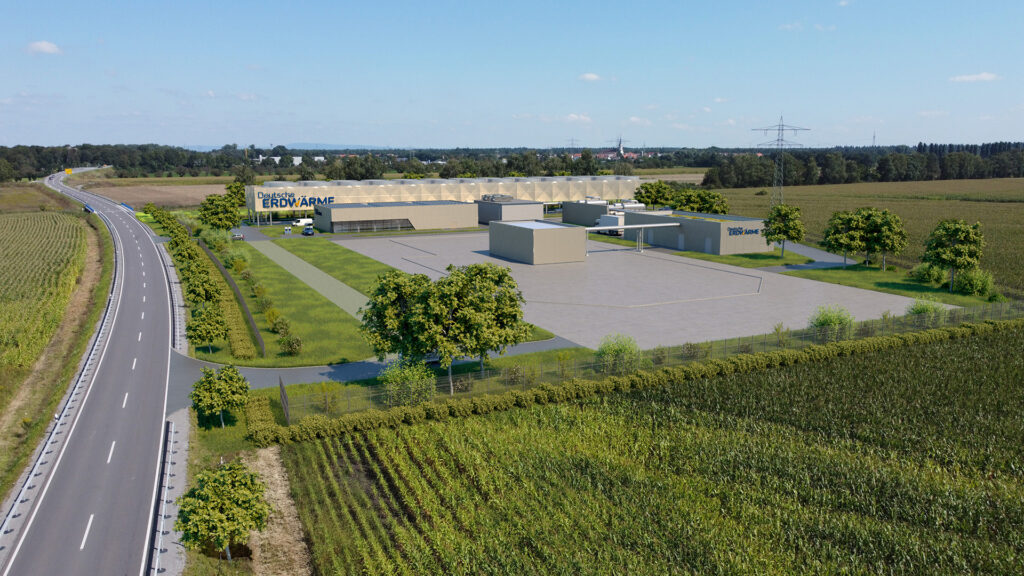
Geothermal energy development in Ethiopia is most advanced in Aluto-Langano, where the country’s first producing geothermal power plant is located. The pilot power plant in Aluto-Langano has an installed capacity of 7.3 MWe. Currently, expansion work is being done at Aluto-Langano with the drilling of new wells with the target of attaining a total 75-MWe capacity.
Since 1981, a total of 13 wells have been drilled at Aluto-Langano. This has helped delineate the boundaries of the geothermal resource and identify upflow and outflow zones.
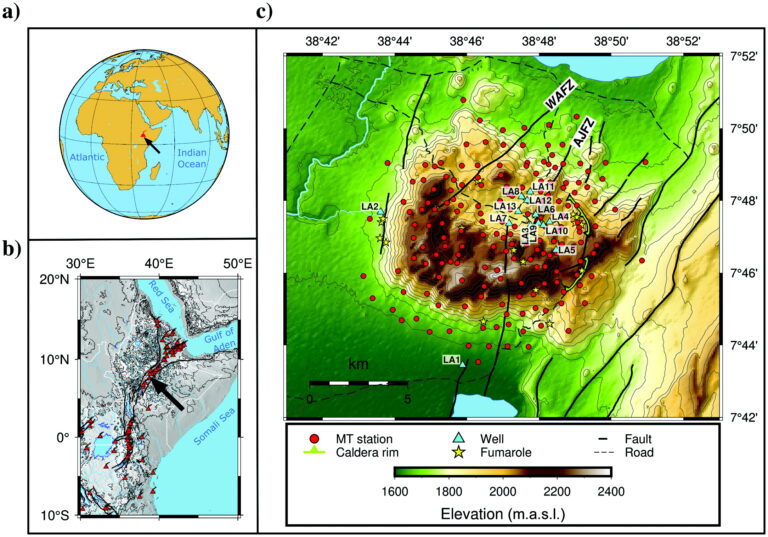
Map showing the drilled wells, structures, surface manifestations, and MT stations at the Aluto-Langano geothermal field, Ethiopia (source: Samrock et al, 2023)
MT data sources and processing
The study uses data collected from regional and local MT surveys along the central MER. The regional data set, collected within the RiftVolc Project (Hübert & Whaler, 2020), consists of 33 MT stations that are distributed across the rift along a profile of ~120 km length and two profiles of ~32 and 60 km length with average site spacings between 4 and 13 km.
The local data set collected by ETH Zurich and the Geological Survey of Ethiopia (GSE) (Samrock et al., 2010) consists of 165 MT sites that cover the edifice of the Aluto volcano (15 × 15 km2), with an average site spacing of 0.7 km. Considering the period range of the MT transfer function and the averaged electrical conductivity distribution in the study area, the penetration depth is calculated to range between approximately 0.5 and 92.5 km, thereby providing a sufficient range for imaging both near-surface and crustal-scale structures
Numerical 3D modeling and inversion of the MT data was done using GoFEM, a 3D inversion code is based on the finite-element technique that exploits adaptive mesh refinement techniques for forward and inverse modeling. Meshes created with GoFEM consist of nonconforming hexahedral cells. This allowed for accurately incorporating real topography, which is crucial considering the terrain of the study area.
The largest electrical conductivity anomaly in the model is the C3 conductor, inferred to be the electrically conductive magmatic melt. The electrical conductivity model suggests that the melt is not distributed uniformly along the imaged lower crustal segment of the SDFZ, but is rather focused in a region spatially confined to the WSW of Aluto. The lateral extent of C3 is about 50 km across the rift and 30 km along the rift with a maximum thickness of ~15 km.
Anomaly C3 terminates at the central rift axis, where a steep dipping conductive channel C2 is imaged. This anomaly is interpreted to be the magma ascent channel in which melt migrates from the deeper melt ponding zone (C3) to the shallow magmatic system beneath Aluto.
At shallower depths, we recover an electrically conductive layer (C1) that extends across the entire width of the rift. This conductor is associated with a shallow layer of pyroclastics and lavas that has been classified as a fissured aquifer, with the high conductivity attributed to a superposition of pore fluid conduction and conduction through a conductive soil component such as clays.
This electrical resistor R1 has already been imaged by previous MT studies who interpreted it to be cooled intrusive rock, which is consistent with the findings of a Bouguer gravity high in the Gademotta caldera.
It is worth noting that the conductivity model for the Aluto-Langano geothermal field is consistent with the low productivity of the first wells (namely LA-1 and LA-2) despite encountering similar lithologies as productive wells. The likely explanation is that hydrothermal alteration products encountered in nonproductive wells LA-1 and LA-2 formed in the past when higher paleotemperatures were locally present.
No evidence for the presence of notable amounts of melt below wells LA-1 and LA-2 can be found in the model. The model reveals only low electrical conductivities below these nonproductive wells, indicative of cooled crystalline rock.
3D illustration
Based on the parameters of the MT model from the study, Lina Jakaite created a 3D illustration of the magmatic-hydrothermal system underneath the Aluto-Langano geothermal field. The illustration shows both the shallow volcanic-hosted geothermal system, the structures that control fluid flow, and the magmatic melt that feeds the volcanic system.
It is worth noting that the actual MT model was used as the basis for the illustration, reflecting crucial components such as the size and position of the clay cap and the magmatic melt.