As battery owners and operators seek to maximise the returns from their assets, they simultaneously face the Herculean challenge of managing degradation. This remains one of the most prominent challenges in the industry, where assets are expected to last around 15 years before reaching End-of-Life (EoL).
Degradation manifests itself in several ways leading to reduced energy capacity, power, efficiency and ultimately return on investment.
Put simply, battery degradation is a serious economic problem which will vary according to how the battery is used. It is therefore essential to monitor factors which drive degradation. These include temperature, ramp rate, average State of Charge (SoC) and Depth of Discharge (DoD).
Analysing the impact of these factors is vital to assessing the cost-benefit of decisions to charge or discharge a battery in response to different market signals.
This is especially important as single/multi-service batteries have the option of participating in a variety of markets, such as frequency regulation or the Balancing Mechanism (BM), and each market can have a different risk level according to the asset’s load profile and cycling behaviour.
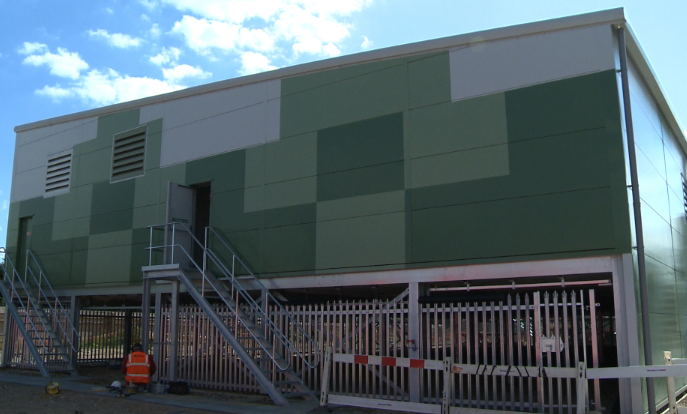
he Big Battery at Leighton Buzzard, England, the first grid-scale lithium battery energy storage system in the UK, connected in 2014. Image: S&C Electric
Back to basics: what 'exactly' is a charge cycle?
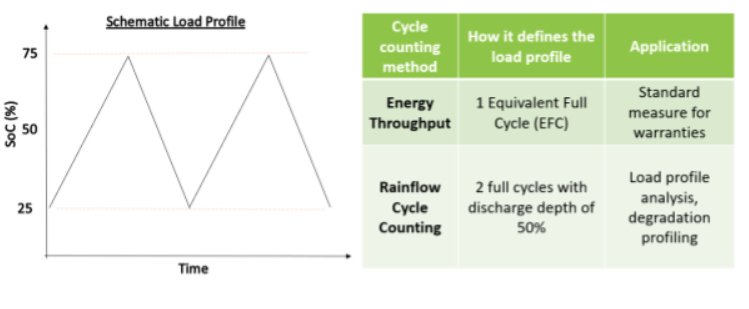
Unfortunately, and confusingly, the industry has different definitions for what ‘a cycle’ actually is. In commercial documents, such as warranties, a cycle is calculated via energy throughput. This tallies the energy going in/out of the battery and divides total energy throughput by capacity. Even though this is a relatively simple calculation, it actually only tells you the number of ‘Equivalent Full Cycles’, or EFCs.
EFCs do not quantify DoD, which factors how deep charge cycles are. As can be seen below, EFCs would be unable to distinguish 1 cycle of 100% DoD vs 2 cycles of 50% DoD vs 10 cycles of 10% DoD. Cycle depth is completely ignored in EFCs! For this reason, KiWi Power utilises the Rainflow algorithm as a tool for profiling each ‘real cycle’ in terms of DoD.
DoD is one of the biggest contributors to degradation. As an example, a Lithium-ion battery has ten times more degradation when operated at near 100% cycle DoD compared to when operated at 10% DoD for the same amount of charged power. It’s likely in the future that DoD measurements will be included in warranties. This will be especially the case as batteries move from frequency regulation, which has shallow cycles, to other programmes such as trading in the BM which requires deeper cycles.
The Rainflow tool and how it can be used for battery profiling
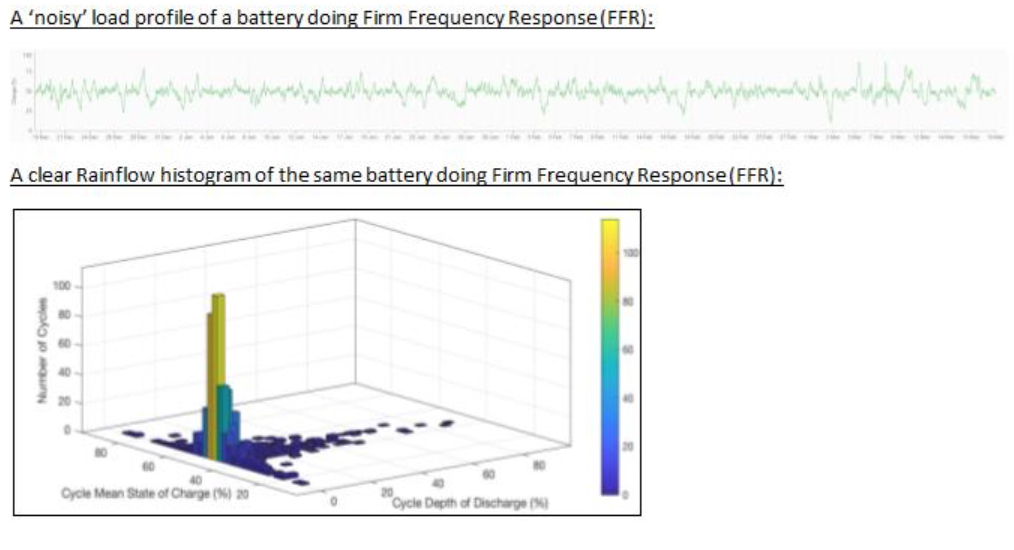
The Rainflow cycle counting tool is an algorithm used for DoD calculation. It takes irregular load profiles and quantifies every cycle’s DoD, mean SoC and time period. This helps to paint a picture of how the battery is behaving and enables the operator to make informed decisions.
As you can see below, a typical load profile can be very noisy and cycle counting manually is near impossible. The Rainflow histogram makes sense of the data by categorising the cycles according to their DoD and mean SoC.
More importantly, the tool tackles the degradation problem by identifying cycles with a high DoD or with cycles that are outside an acceptable SoC range.
Energy trading in the UK’s Balancing Mechanism (BM) market
Energy trading will require deeper cycling. KiWi Power’s analysis suggests DoD is typically 20-30% higher for assets in the BM compared to firm frequency response (FFR). Average SoC on the other hand, will vary enormously depending on the price points set in the BM model. Without a SoC management plan in place, active pricing strategies will result in an asset having a very low average SoC (often <20%) while passive pricing strategies will result in an asset having a high average SoC (often >80%).
As battery business cases increasingly rely on wholesale and BM participation, these figures demonstrate the need to select a battery management system that captures these insights to mitigate degradation risk and optimise revenue.
KiWi Power’s expert team use our intelligent technology, deep market insight and unparalleled asset knowledge to do just this. Since connecting the UK’s first grid-scale battery at Leighton Buzzard in 2014 our portfolio has grown to over 50MW of behind-the-meter and grid-scale energy storage systems which we monetise on behalf of asset owners and investors. Our novel approach to measuring battery load profiles and analysing charge cycles is one way we’re able to ensure our client’s assets deliver maximum value and life expectancy.