Consumption by country
China (4 136 million t) constituted the country with the largest volume of coal consumption, accounting for 69% of total volume. Moreover, coal consumption in China exceeded the figures recorded by the second-largest consumer, India (1 012 million t), fourfold. Japan (186 million t) ranked third in terms of total consumption with a 3.1% share.
From 2007 to 2019, the average annual growth rate of volume in China amounted to +3.7%. In India, the average annual rate of growth amounted to +5.2%/y, while in and Japan, the volume of consumption remained relatively unchanged against its outset level.
In value terms, China (US$572.6 billion) led the market, alone. The second position in the ranking was occupied by India (US$90.7 billion). It was followed by Japan.
The countries with the highest levels of coal per capita consumption in 2019 were Australia (4.85 t per person), China (2.84 t per person) and South Korea (2.78 t per person).
From 2007 to 2019, the biggest increases were in Indonesia, while coal per capita consumption for the other leaders experienced more modest paces of growth.
Production in Asia Pacific
In 2019, production of coal increased by 3% to 5 771 million t, rising for the third consecutive year after three years of decline. The total output volume increased at an average annual rate of +3.3% from 2007 to 2019; however, the trend pattern indicated some noticeable fluctuations being recorded in certain years. The pace of growth appeared the most rapid in 2010 with an increase of 12% y/y. The volume of production peaked in 2019 and is expected to retain growth in the immediate term.
Production by country
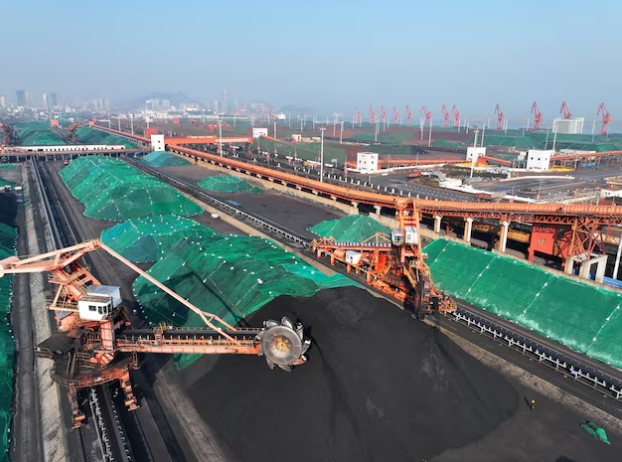
China (3 842 million t) constituted the country with the largest volume of coal production, comprising approximately 67% of total volume. Moreover, coal production in China exceeded the figures recorded by the second-largest producer, India (760 million t), fivefold. Indonesia (536 million t) ranked third in terms of total production with a 9.3% share.
In China, coal production expanded at an average annual rate of +3.0% over the period from 2007-2019. The remaining producing countries recorded the following average annual rates of production growth: India (+3.7%/y) and Indonesia (+7.8%/y).
Imports in Asia Pacific
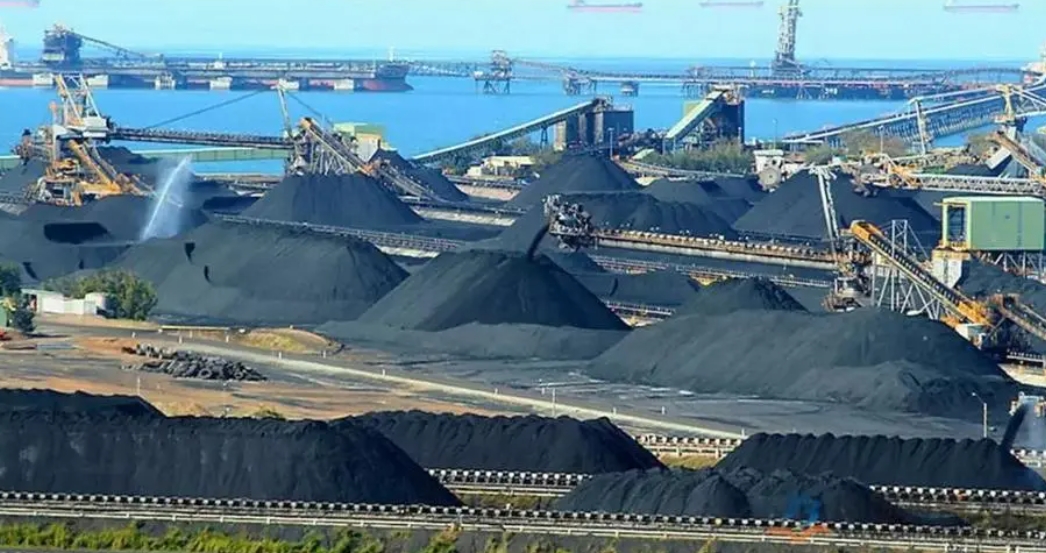
In 2019, supplies from abroad of coal increased by 2.2% to 1 093 million t, rising for the fourth consecutive year after 2 years of decline. Total imports indicated a resilient expansion from 2007 to 2019: its volume increased at an average annual rate of +6.7% over the last 12 years. The trend pattern, however, indicated some noticeable fluctuations being recorded throughout the analysed period. Based on 2019 figures, imports increased by +24.1% against 2015 indices. The volume of import peaked in 2019 and is likely to see gradual growth in years to come.
In value terms, coal imports contracted to US$102 billion (IndexBox estimates) in 2019. In general, imports posted a buoyant expansion. The pace of growth was the most pronounced in 2008 with an increase of 79% y/y. The level of import peaked at US$110.7 billion in 2018 and then shrank in 2019.
Imports by country
In 2019, China (300 million t), India (254 million t), Japan (186 million t) and South Korea (141 million t) were the main importers of coal in Asia Pacific, creating 81% of total import. They were distantly followed by Taiwan, Chinese (67 million t), committing a 6.1% share of total imports. The following importers - Malaysia (34 million t) and the Philippines (27 million t) - together made up 5.6% of total imports.
From 2007 to 2019, the most notable rate of growth in terms of purchases, amongst the main importing countries, was attained by China, while imports for the other leaders experienced more modest paces of growth.
In value terms, China (US$23.4 billion), Japan (US$23.3 billion) and India (US$23 billion) appeared to be the countries with the highest levels of imports in 2019, together accounting for 68% of total imports.
China saw the highest growth rate of the value of imports, among the main importing countries over the period under review, while purchases for the other leaders experienced more modest paces of growth.
Import prices by country
The coal import price in Asia Pacific stood at US$93/t in 2019, waning by -9.9% against 2018. Import price indicated tangible growth from 2007 to 2019: its price increased at an average annual rate of +2.4% over the last 12-year period. The trend pattern, however, indicated some noticeable fluctuations being recorded throughout the analysed period. The pace of growth appeared the most rapid in 2008 when the import price increased by 71% y/y. Over the period under review, import prices reached the maximum at US$130/t in 2011; however, from 2012 to 2019, import prices stood at a somewhat lower figure.
Prices varied noticeably by the country of destination; the country with the highest price was Japan (US$125/t), while the Philippines (US$70/t) was amongst the lowest.
From 2007 to 2019, the most notable rate of growth in terms of prices was attained by Malaysia, while the other leaders experienced more modest paces of growth.
Source :https://www.indexbox.io/store/world-cement-market-report-analysis-and-forecast-to-2020/